Product system / Canvasm

Map strategy, actions, metrics and evidence in one operating model.

Canvasm turns a strategy document into a system that people and agents can work from. Outcomes, drivers, metrics, actions, hypotheses and evidence stay connected instead of living in separate decks, task boards and dashboards.

CanvasmProduct systemStrategy to execution

01 The build

Strategy becomes useful when the team can operate it.

Canvasm gives each business element a defined role and relationship. Teams can see why a metric matters, which action is meant to move it, what assumption is being tested and which evidence supports the update—without losing the wider commercial model.

Visit Canvasm
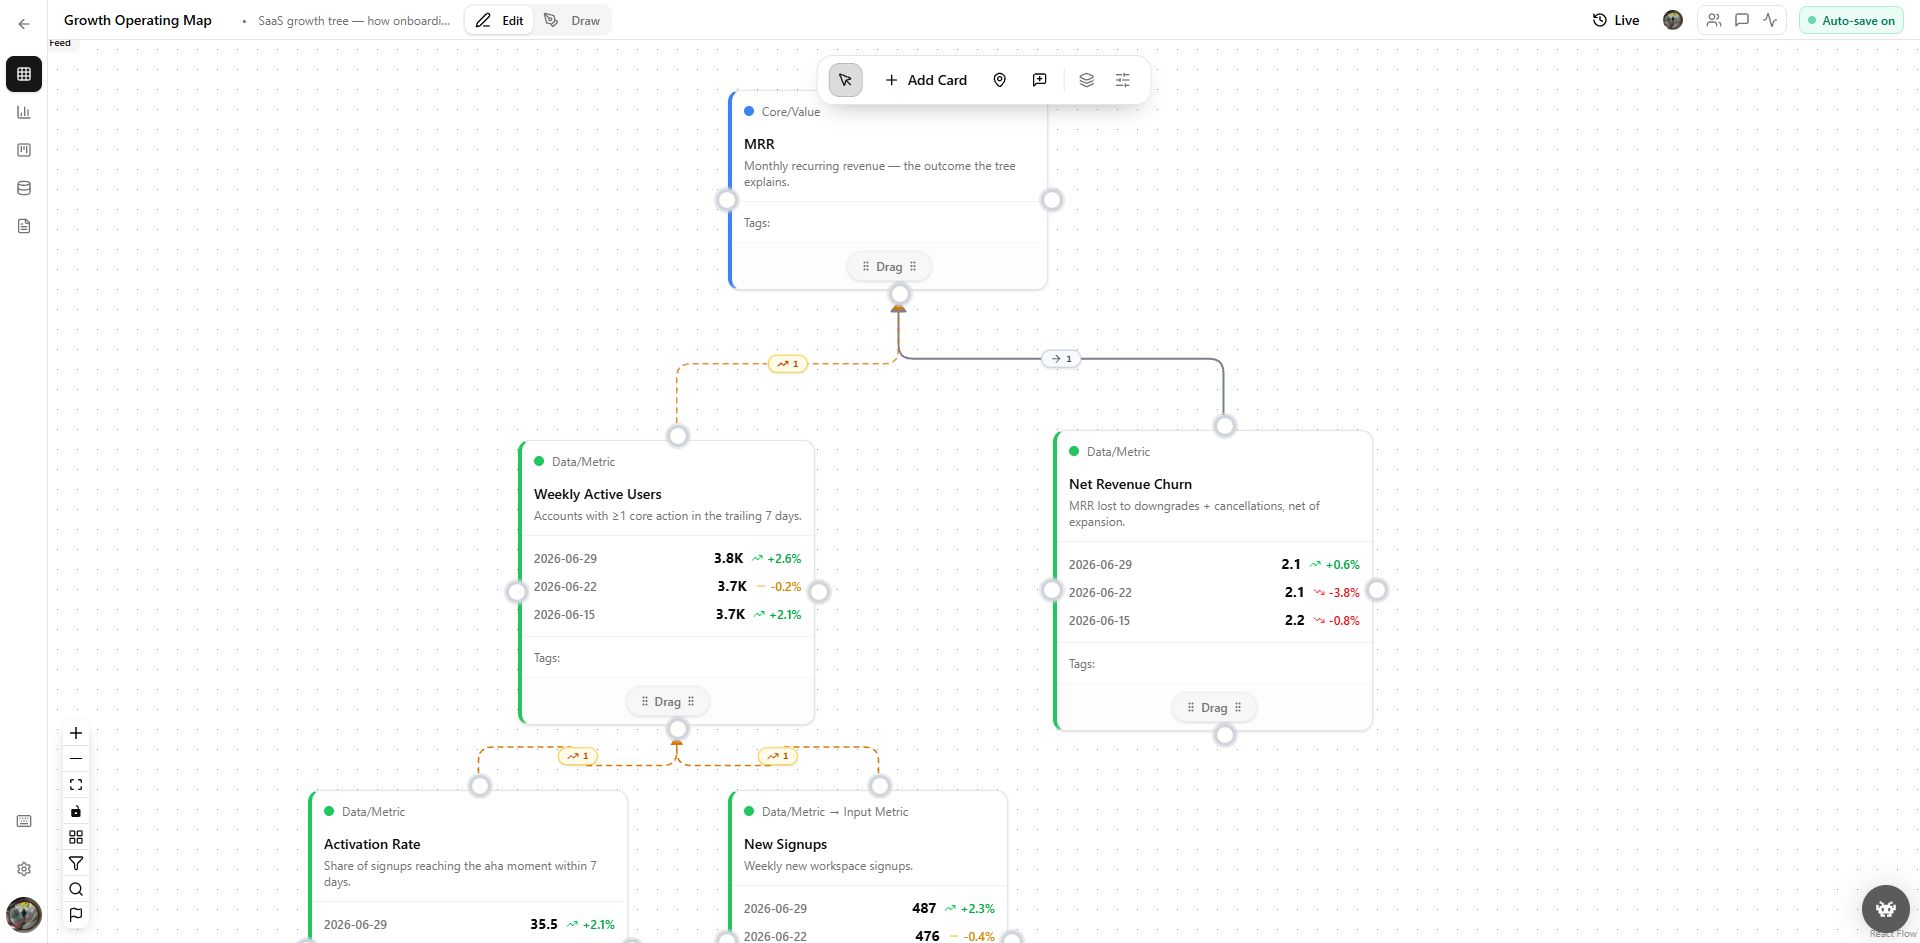
Canvasm growth operating map connecting recurring revenue to usage, churn and activation metrics
Product
Canvasm
Build
Visual business operating system
Used for
Strategy, metrics, actions and evidence
Current proof
Working product views and a client implementation

02 Operating logic

The model connects intent to observable evidence.

A commercial outcome is decomposed into its drivers and metrics. Actions and hypotheses are attached to the part of the model they are intended to change, then reviewed against current evidence.

  1. 01Outcome
  2. 02Drivers
  3. 03Metrics
  4. 04Actions
  5. 05Hypotheses
  6. 06Evidence
  7. 07Review

03 Product walkthrough

See the system page by page.

Each screen has a specific operating job. The screenshots below show the current product interface, followed by the function it performs inside the wider workflow.

01Canvas
Canvasm visual operating map with linked revenue and growth metrics

Canvas

See the causal model, not only the final KPI.

Cards represent outcomes, metrics, work and hypotheses. Typed relationships and confidence make the operating logic inspectable instead of leaving it implicit in a slide deck.
02Dashboard
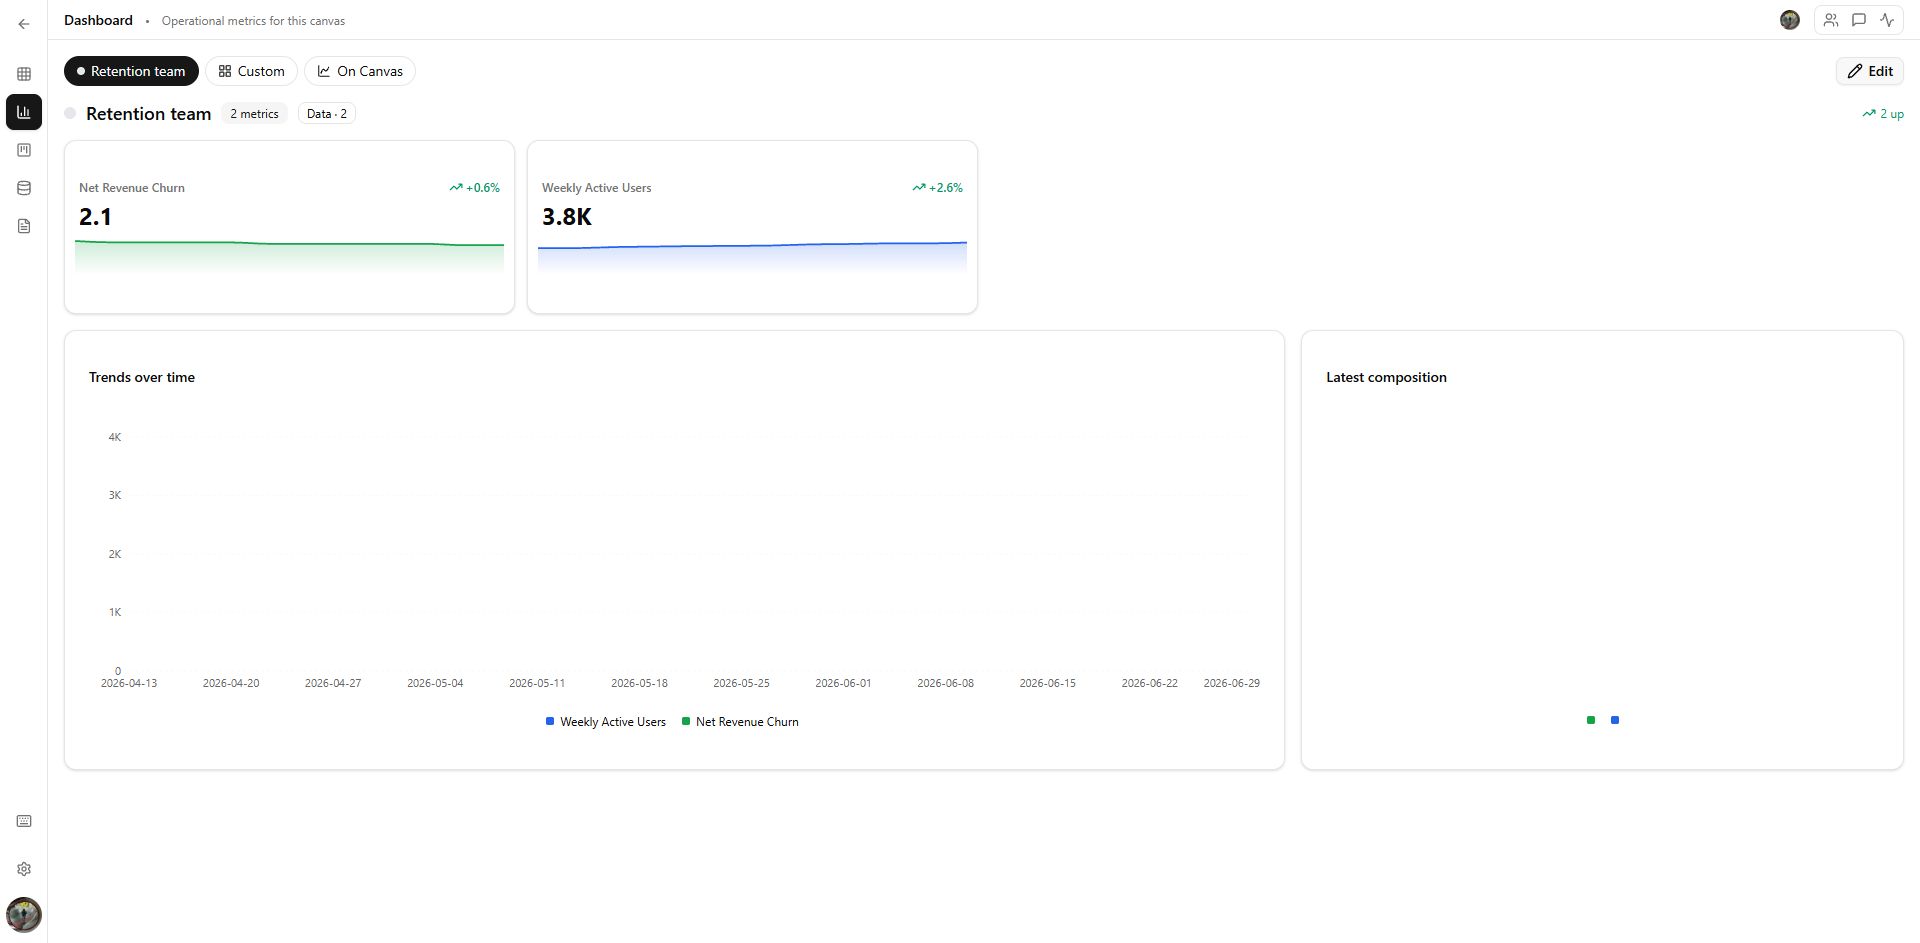
Canvasm metric dashboard with retention and active-user trends

Dashboard

Read current state and trend inside the same model.

Selected metric groups show the latest value, direction and time series so performance review stays connected to the strategic context that gave the metric meaning.
03Strategy
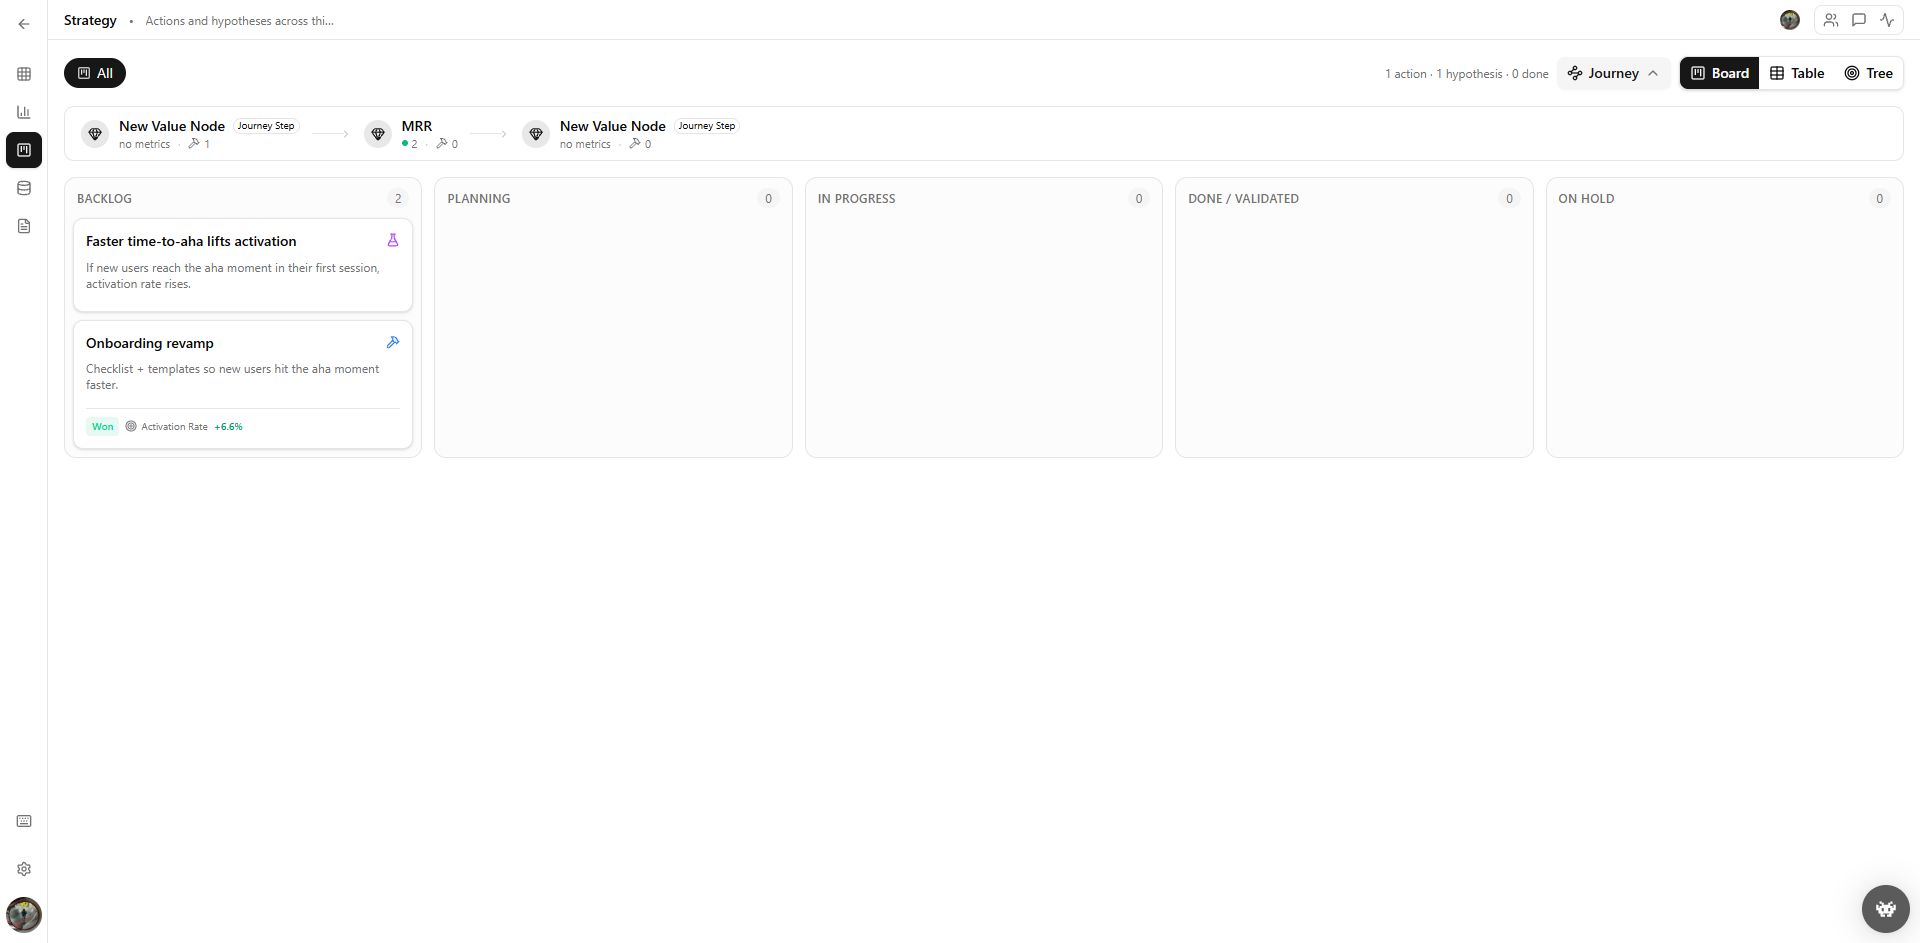
Canvasm strategy board with action and hypothesis cards

Strategy

Move actions and hypotheses through an explicit workflow.

Board, table and tree views organize backlog, planning, in-progress, validated and on-hold work. A completed bet can retain its measured result next to the metric it targeted.
04Client implementation
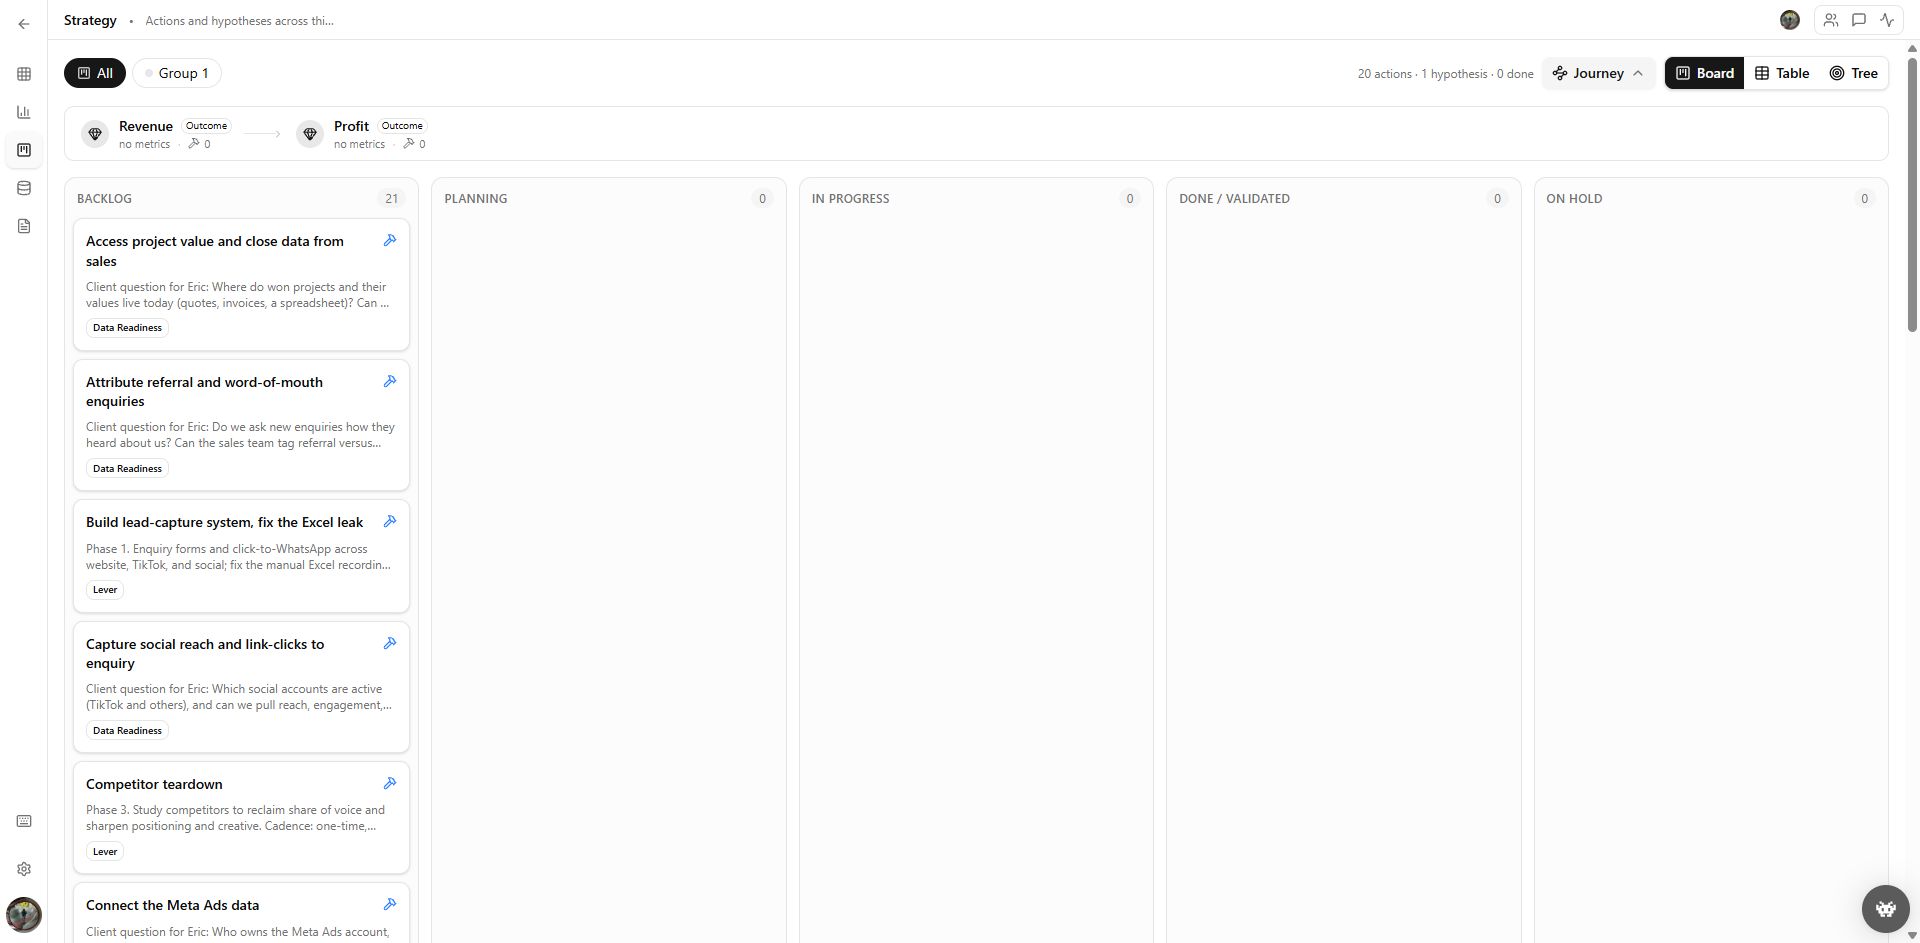
Canvasm client strategy board for Tile Concept and TC Wall Panel

Client implementation

Translate a real engagement into accountable work.

The Tile Concept implementation turns the profit-driver model into concrete data-readiness questions, marketing levers, bets, monitoring work and owners.
05Assets
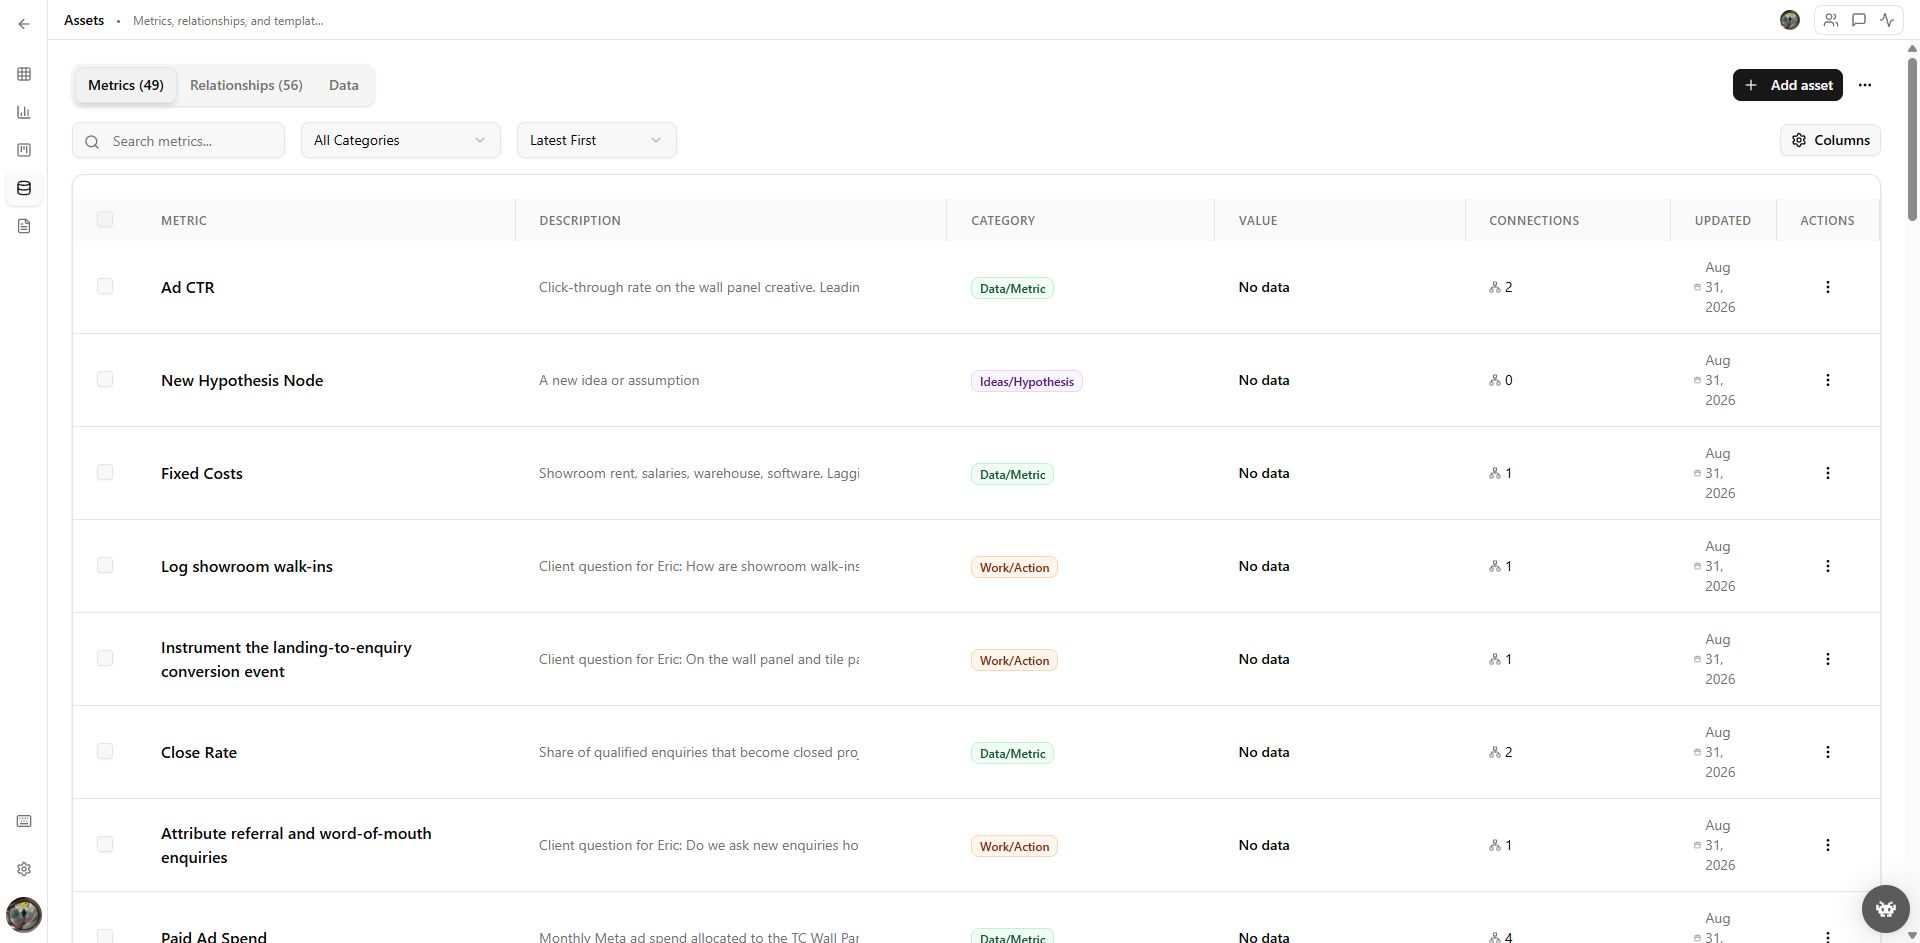
Canvasm asset library with metrics, actions and relationships

Assets

Keep metrics and relationships reusable and governed.

The asset library exposes descriptions, categories, current data, relationship counts and update state so the canvas does not become an unstructured diagram.

04 Page map

What every area is responsible for.

01

Canvas

Visual map of outcomes, drivers, metrics, actions, hypotheses, groups and relationships.

02

Dashboard

Grouped metric values, trend direction, time series and current composition.

03

Strategy

Actions and hypotheses across board, table, tree and journey views.

04

Assets

Searchable metric, relationship and data library with definitions and update state.

05

Evidence

Evidence items linked to the cards and relationships they support or challenge.

05 What this proves

Working product evidence, stated precisely.

  • The strategy model, working backlog, metric dashboards and evidence layer exist in one product.
  • The same structure can express a generic growth model and a client-specific operating engagement.
  • Relationships and metric history keep the map operational rather than purely visual.

The SaaS growth metric values shown are demo data. The Tile Concept views demonstrate implementation structure; they do not claim a measured client outcome unless separately verified and approved for publication.

Next Focused diagnostic

Need to turn a strategy into a system your team can actually run?

Show us the operating constraint, the systems already in place and the decision your team needs to make faster.

Start a conversation